 Your cart is empty.
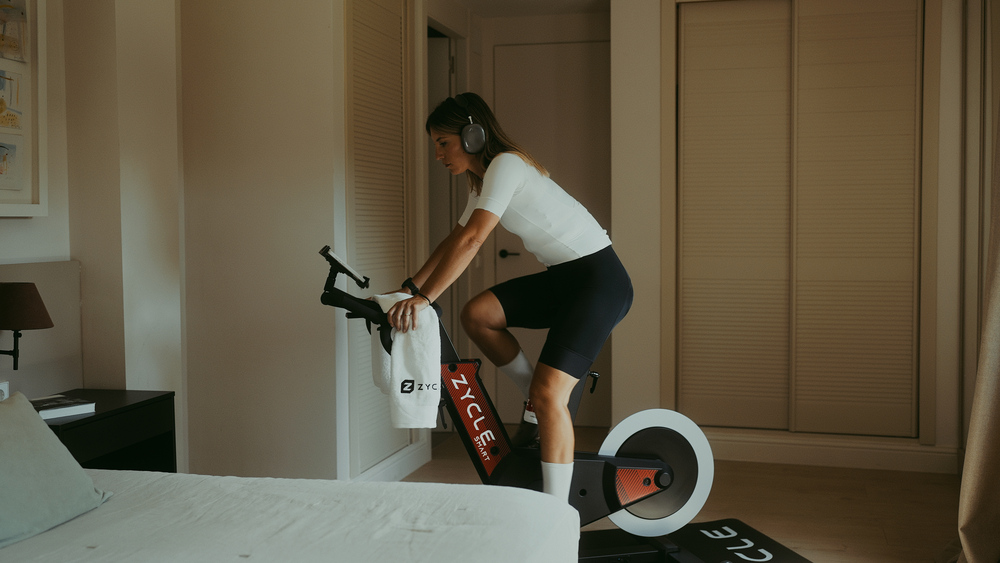
You have programmed an hour at constant power. The watts barely change, but your heart rate ends up higher even though the app shows the same target. That difference is usually called cardiac drift in cycling and can provide useful information about the session. To interpret it, look at which section is being compared and the conditions around you during the ride.
Heat, fatigue or a sensor giving inaccurate readings can alter the curve. A rise in heart rate is not enough to judge your fitness. Interpret it alongside power, how you feel and the context of similar workouts.
What you are seeing when heart rate separates from power
During a prolonged, fairly steady effort on the trainer, heart rate may increase as the minutes pass even if power stays the same. This physiological phenomenon does not mean the trainer has added load.
If you want to use heart rate during the session, review how to control intensity with a heart rate monitor indoors and check that the signal is reliable before drawing conclusions. TrainingPeaks uses the relationship between power and heart rate to calculate aerobic decoupling. It compares the efficiency of the first half of a sustained section with the second. The resulting figure describes that particular effort, with its duration and power. It is not a clinical diagnosis, a direct lactate measurement or a verdict on all your training.
Choose a section you can compare
Look for a section with relatively even power and no long stops. Leave out the warm-up, cool-down and abrupt changes in intensity. If the first half includes a demanding virtual climb and the second is an easy ride, the comparison loses its meaning. TrainingPeaks notes that sections shorter than twenty minutes are less suitable for this analysis. Look at the average power and heart rate for each half alongside perceived effort.
A hypothetical example: you maintain around 160 W for fifty minutes and average heart rate rises from 132 to 142 beats per minute. Before attributing the change to a lack of aerobic base, check whether the room warmed up or whether you stopped drinking during a long session.
Mark the start and end of your chosen section. In the next session, compare a block of similar duration and power instead of looking for the most favourable percentage by selecting different sections. Use the same sensors whenever possible, too. If you change your power meter or heart rate strap, note it before attributing the difference to your training.
Heat and ventilation matter too
On an outdoor ride, air flows over you for much of the route. At home, a session at the same power can feel very different without a fan or in a warmer room. Heat and fluid loss can increase cardiovascular demand.
A graph recorded at home cannot identify a single cause for a rise in heart rate. To compare sessions, keep ventilation similar and note temperature, humidity and hydration. You can read how to organise hydration for sessions in the heat if you train for more than an hour. A fan and adequate hydration help control the environment without eliminating every variation in heart rate.
If dizziness, chest pain, unusual breathlessness or severe discomfort appear during the session, stop exercising and seek help. These symptoms are not interpreted through a decoupling percentage. Nor should you force yourself to hold power just to maintain a relationship between the curves that you cannot comfortably sustain that day.
What power adds when interpreting drift
Power confirms whether the mechanical load remained steady. If heart rate rises along with watts, you are looking at a different situation. A repeatable target helps you compare, but you still need duration, temperature and how you felt to interpret the effort. On a smart trainer, you can programme a sustained block. If you train on rollers such as our RooDol for riding indoors, you will need a separate power meter to compare power and heart rate using the same method. The rollers do not replace that meter. With either setup, note the data source and avoid mixing figures from different devices between weeks.
TrainingPeaks mentions low decoupling values as a possible sign of good aerobic endurance for a particular duration and power. This is a guide for analysing training, not a universal threshold. A short route, an interval session or an especially hot day should not be assessed in the same way as a long, even block in normal conditions.
Compare trends, not an isolated session
Repeat a similar block and note duration, power, heart rate, ventilation and how you felt. If heart rate rises less at a comparable load over several weeks, you have a clue that adaptation is taking place. One poorer session, especially in the heat or after poor rest, does not justify rewriting the plan.
Use the reading to decide on your next workout
After finishing a block with substantial drift, think back to how you felt going into the last fifteen minutes. Could you still hold a conversation, or did maintaining the watts mean gritting your teeth? The answer, together with how much rest you have had, helps you choose between an easy ride, a day off or the planned session.
Working with power in indoor cycling gives you a reference for repeating the effort. Even so, the number does not decide on its own: a block that feels uncomfortable today may say more about the temperature or how demanding your week has been than about a change in your aerobic capacity.
On your next steady ride, note the section you will analyse and the room conditions before looking at the percentage. Return to those details when your heart rate rises. Drift is useful when it explains a trend between comparable sessions, not when it becomes a daily test you have to pass.