

 Cart is empty
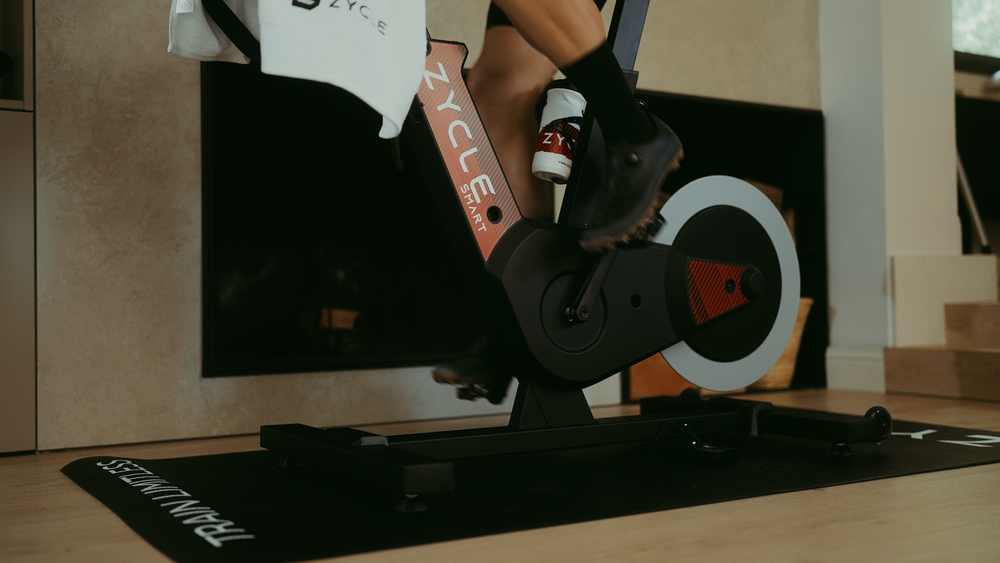
Training with power lets you analyze a session more precisely than if you only focus on speed or how you feel. In indoor cycling, where the environment is stable and data is recorded continuously, metrics like TSS, IF, and Normalized Power help you better understand the true training load and make decisions with less guesswork.
These metrics may seem difficult at first, but they all reflect a simple idea: knowing how much you’ve demanded from your body, at what relative intensity, and which power best represents the effort performed. When you interpret them together, they help you fine-tune your weeks on the indoor bike or trainer, especially if you alternate easy sessions, intensity blocks, and long workouts.
What TSS measures in cycling
TSS, or Training Stress Score, estimates the total load of a session by combining duration and intensity. It doesn’t measure only how long you’ve pedaled, but how costly that time was relative to your capacity. That’s why a short but intense session can rack up a TSS similar to a longer ride at a moderate pace, even though how it feels at the end can be very different.
To understand it well, it helps to be clear about your training zones, because TSS depends on relative intensity. An easy hour doesn’t create the same load as an hour near threshold. Indoors, this is especially useful because you can repeat similar sessions and compare their impact with less external noise, such as wind, traffic, or changes in terrain.
It also helps you organize the week. If one day you do an active recovery session, TSS should be low. If the next day you complete intervals near threshold, the value will rise even if the workout is shorter. That difference lets you see whether you’re accumulating load progressively or stacking too many demanding days.
What IF adds to reading intensity
IF, or Intensity Factor, indicates how demanding a session has been relative to your FTP. If the value is close to 1, the workout has been near your functional threshold power. If it’s well below, the session was more controlled. This way you can distinguish between comfortable volume, sustained work, and truly intense efforts without focusing only on duration.
IF is useful when you don’t want to rely only on average watts. Two workouts can have a similar average power, but one may include pace changes while the other is much steadier. On a smartbike or on smart indoor bikes like those from ZYCLE, power readouts make this comparison more reliable.
In practice, IF helps you label each session more accurately. An aerobic ride may sit at moderate values, while a threshold or VO2max session will show a higher intensity factor. If all your workouts have a high IF, you may be leaving too little room to absorb the load and arrive fresh for the key days.
Normalized Power and average power are not the same
Normalized Power tries to represent the power that best summarizes the physiological cost of a variable session. Average power calculates a simple mean, while Normalized Power gives more weight to changes in intensity. That’s why it’s usually higher when you do intervals, pace changes, or blocks with short recoveries.
Imagine a 60-minute session with several hard intervals and easy rests. Average power may look moderate because the rests pull the mean down, but Normalized Power will show that your body has handled demanding peaks. This difference helps you better assess structured indoor workouts and prevents you from undervaluing sessions that look easy when you only check the average.
That’s why Normalized Power is often a more useful reference in sessions with changes of pace. If you do a continuous block at a steady intensity, it may be very close to average power. If you alternate hard efforts and recoveries, the gap between the two metrics grows and reveals the variability of the effort more clearly.
How to interpret the three metrics together
TSS tells you how much load you’re accumulating, IF helps you see the relative demand, and Normalized Power provides a more realistic read of the effort when the session hasn’t been steady. No single metric explains everything on its own. The key is to look at them together and compare them with how you feel, your recovery, and the goal for the week.
If a workout has high TSS and low IF, it was probably long but controlled. If it has medium TSS and high IF, it may have been short but demanding. If, in addition, Normalized Power clearly exceeds average power, you likely worked with pronounced changes of pace. Reading them together helps you avoid labeling all hard sessions the same way.
When to trust the data and when to listen to your body
Metrics help you make better decisions, but they don’t replace listening to your body. Perceived exertion remains important, especially when you sleep poorly, build up fatigue, or notice that a usual session feels harder than normal. The data guides you, but the sensation confirms whether you can sustain the load.
A clear example is when you repeat an interval session two weeks in a row. If TSS and IF are similar, but the second time requires much more perceived effort, you may not have recovered well. In that case, the numbers don’t say everything is perfect. They give you a basis for comparison, and your body adds the context.
A good read combines data and sensations. If your weekly TSS rises sharply and your legs respond worse, you may need to reduce the load. If IF indicates a hard session but you completed it under control, it may be a sign of adaptation. Indoors, that combination lets you train with better judgment and adjust before fatigue builds up too much.
How to use these metrics in your indoor week
To improve, you don’t need to chase high values all the time. You can alternate low-load days, medium-intensity sessions, and more demanding workouts. Weekly TSS helps you monitor accumulation, while IF shows which days were tougher. This way you avoid turning every session into a test and leave space for recovery.
You can also use these metrics to plan progressions. You can increase the load little by little, without sudden jumps. A simple example would be to keep two steady sessions during the week and save a harder workout for when you’re rested and can take advantage of it. That way, the data helps you build consistency, not just review the workout after it’s already over.
A balanced week can combine one aerobic ride day, one sustained-work day, and a shorter intensity session. If total TSS rises gradually and the IF on hard days doesn’t spike constantly, progression is usually more sustainable. This reading prevents enthusiasm from leading you to string together too many demanding workouts.
The most useful way to use TSS, IF, and Normalized Power is to see them as a dashboard, not an obligation. If you want to improve endurance on the bike, these data can guide progression. If they start making you chase numbers without context, they lose their meaning. What matters is that each metric improves your decisions on the bike.